

Step 1 of 5

Discover
We learn your goals, your customers and your limits, then agree in writing what success looks like before any work starts.
OutcomeScope, plan and price
Dashboards and reports that bring your sales, marketing and operations data together, so you always know what to do next.
Most businesses already have the data they need. It is just spread across spreadsheets, billing software, ad accounts and apps, and pulling a simple report takes someone a day every month.
We connect those sources, clean the data and build dashboards in Power BI or Looker Studio that update on their own. Your team sees sales, margins, marketing results and operations in one place, with the few numbers that matter on top.
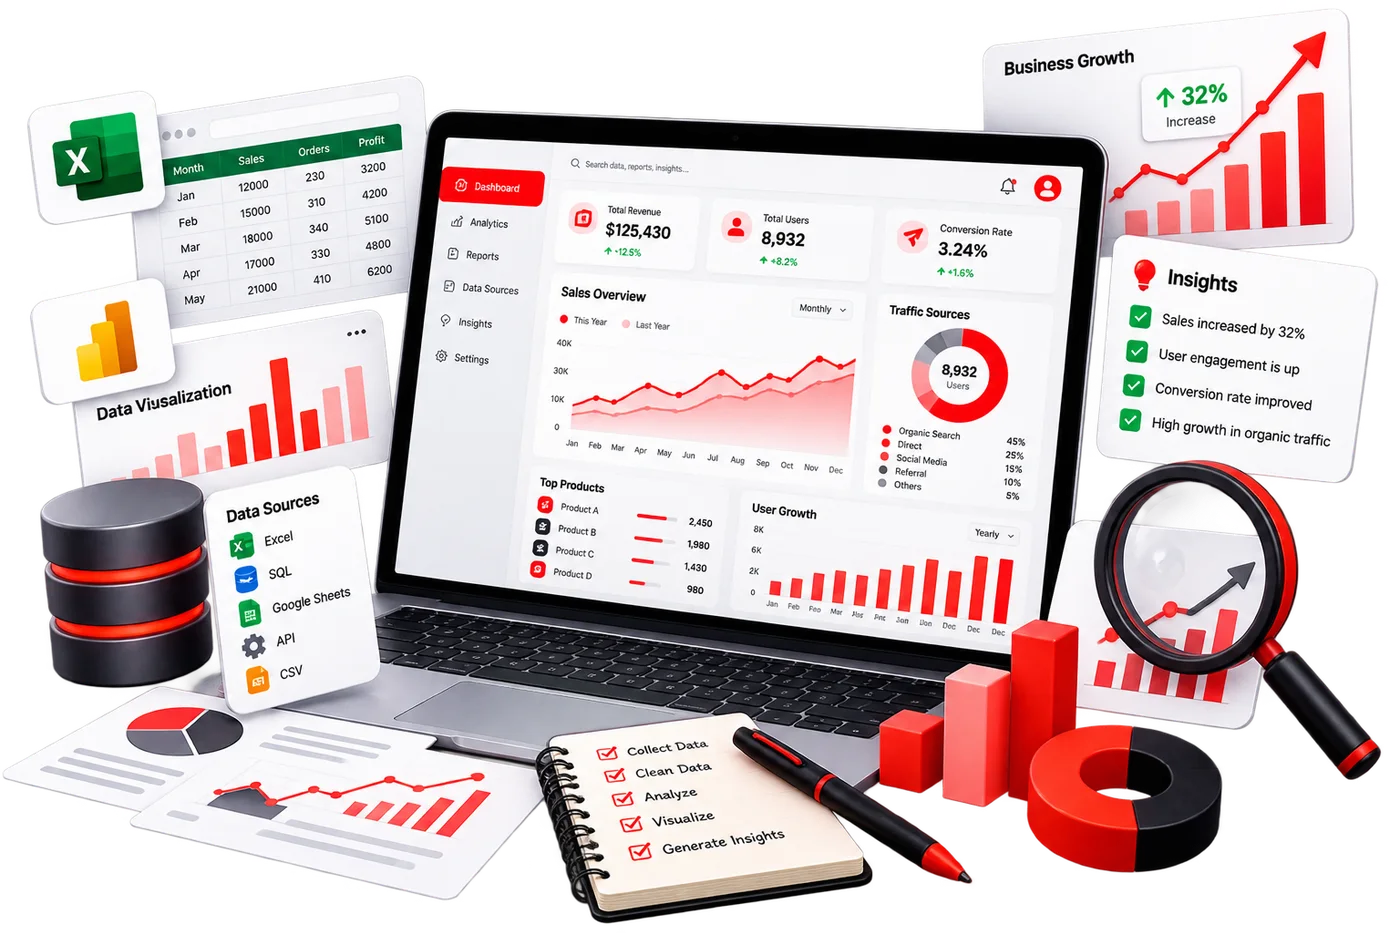
We work with businesses in Kumbakonam, across Tamil Nadu and India, and further afield. These are the situations we are asked about most.
One dashboard that shows how the business is doing today, without waiting for month-end reports.
Reports that connect campaigns to leads and revenue, so budget goes where it works.
Stock, orders, delivery and staff numbers tracked in real time.
Clean data pipelines that are ready for forecasting and AI later on.
The same five stages on every project, from the first call to launch and beyond. You always know what happens next, what you will see at the end of it and what we need from you.
We learn your goals, your customers and your limits, then agree in writing what success looks like before any work starts.
OutcomeScope, plan and price
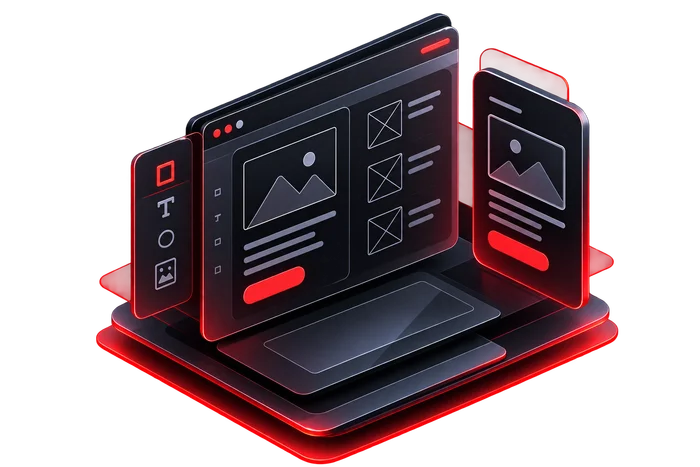
Flows, wireframes and visual designs you can click through and approve. No surprises once building begins.
OutcomeApproved prototype
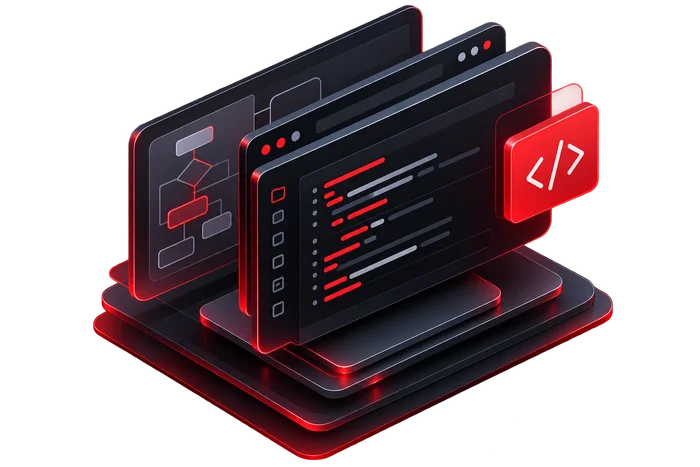
Development in short cycles with a working demo every two weeks. You see real progress, not status reports.
OutcomeTested product

A careful release with monitoring, documentation, access handover and training for your team.
OutcomeLive and documented

Support, improvements and marketing after launch, guided by what real users do.
OutcomeOngoing results
Mainly Power BI and Looker Studio, with SQL, Python and BigQuery behind them when the data needs more work. We recommend the tool that fits your team and budget.
Most projects use more than one service. Here is everything else the same team can take on.